Easy Shipping From Global, Save Cost
Navigating the Seas of Commerce: A Data-Driven Analysis of China-US Shipping Costs
Core Cost Comparison Table (2025 Data)
The following table summarizes shipping costs, transit times, and key use cases for primary shipping modes from China to the US, based on 2025 market data:
| Shipping Mode | Cost Range | Transit Time | Typical Cargo | Key Cost Drivers |
|---|---|---|---|---|
| Express (DHL/FedEx) | -<21kg:>- >21kg: ¥30–50/kg | 2–5 days | Urgent documents, high-value goods | Fuel surcharges (10–30%), dimensional weight |
| Air Freight | - 45–100kg: $40–50/kg - >100kg: $33–36/kg | 7–10 days | Light/valuable goods (electronics, apparel) | Base rate (65%), fuel surcharges (18%) |
| Ocean Freight (FCL) | - 20ft container: $2,600–$2,850 - 40ft container: $3,200–$3,750 | 30–40 days | Bulk goods (furniture, machinery) | Marine fuel (20–30% of cost), port fees |
| Ocean Freight (LCL) | $680–$800/cbm + delivery fees | 35–45 days | Small-volume cargo (samples, parts) | Volume weight, consolidation fees |
| Rail (China-Europe-US) | $25–$30/kg | 25–35 days | Non-urgent bulk goods | Railway tariffs, cross-border transit fees |
| EMS Postal | - First 0.5kg: ¥240 - Subsequent 0.5kg: ¥75 | 10–15 days | Small parcels (personal goods) | Weight tiers, customs clearance fees |
Tariff Impact on Landed Costs (2025 Scenarios)
Tariff fluctuations directly affect the final cost of goods. The table below compares landed costs for a $1,000 product under different tariff regimes:
| Tariff Scenario | Tariff Rate | Total Landed Cost | Cost Increase vs. Current | Example Impact |
|---|---|---|---|---|
| Pre-2025 (historical) | 145% | $2,450 | +88% | A $100 electronic part costs $245 at retail |
| May 2025 (current) | 30% | $1,300 | Baseline | Same part costs $130 |
| Proposed August 2025 | 70% | $1,700 | +31% | Part costs $170, pushing retail prices up |
Seasonal Cost Variations (2025)
Shipping costs fluctuate with demand. The table highlights peak/off-peak rate adjustments:
| Season | Ocean Freight (FCL) | Air Freight | LCL | Key Driver |
|---|---|---|---|---|
| Peak (Aug–Nov) | +15–20% | +10–12% | +10–15% | Holiday shopping (Black Friday, Christmas) |
| Off-Peak (Mar–Apr) | -10–12% | -8–10% | -5–8% | Reduced demand post-Chinese New Year |
| Transitional (Jun–Jul) | Base rate | Base rate | Base rate | Stable demand before peak season |
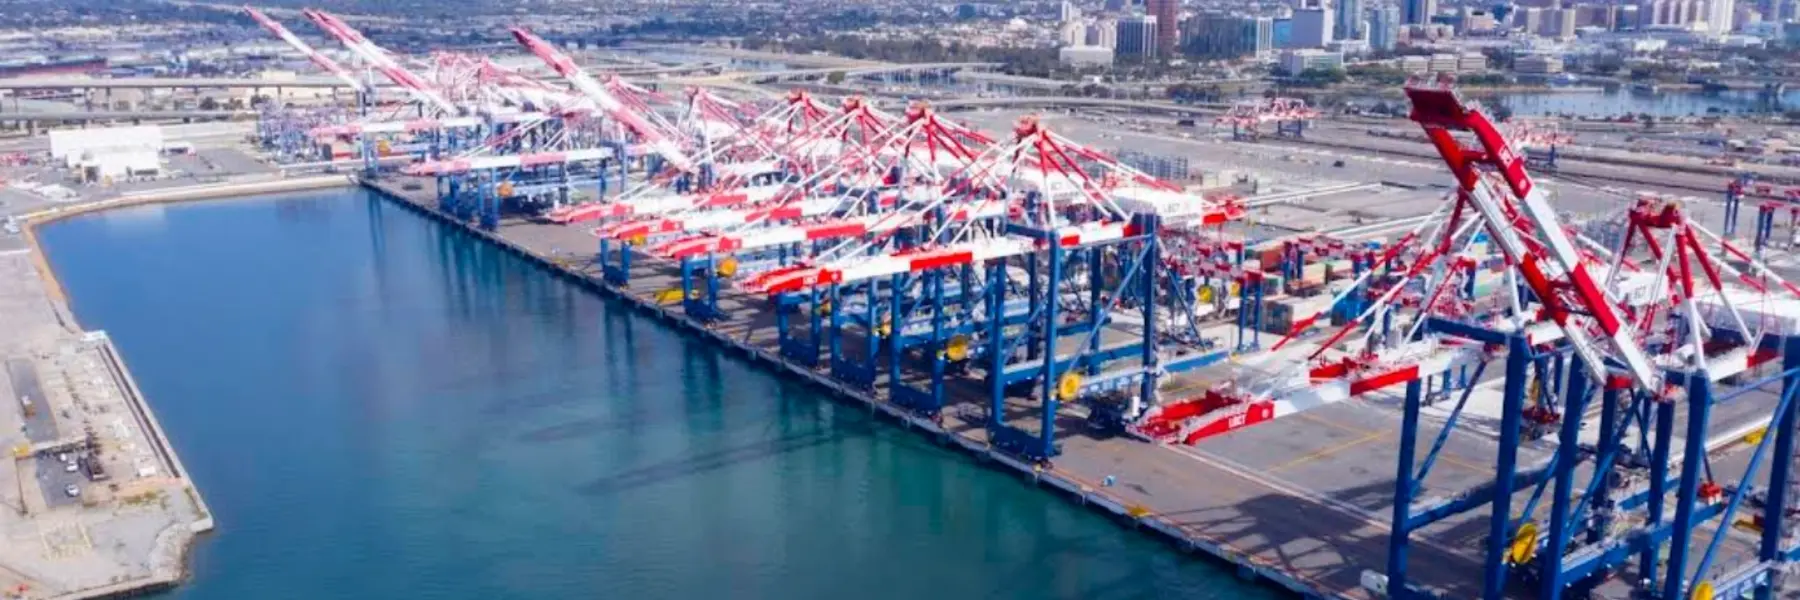
Port Efficiency Comparison (2025)
Port congestion and operational efficiency impact transit times and indirect costs. Data for major US ports:
| US Port | Avg. Transit Time (Days) | Congestion Surcharge | Volume Handled (Jun 2025) | Operational Capacity |
|---|---|---|---|---|
| Los Angeles/Long Beach | 32.5 | $0–$100/container | 1.8M TEUs | 60–70% |
| New York/New Jersey | 45 | $300–$500/container | 1.2M TEUs | 85–90% (near capacity) |
| Savannah | 38 | $150–$200/container | 950K TEUs | 70–75% |
Cost Breakdown: Air Freight Components (500kg Shipment)
Air freight costs include multiple components. The table below details the breakdown for a 500kg shipment from Guangzhou to New York:
| Cost Component | Percentage of Total | Absolute Cost | Key Notes |
|---|---|---|---|
| Base Rate | 65% | $2,275 | Determined by weight/volume and route |
| Fuel Surcharge | 18% | $630 | Tied to global oil prices (10% oil = +2% surcharge) |
| Customs Clearance | 10% | $350 | Includes document processing and inspections |
| Security Fees | 7% | $245 | Mandatory for air cargo post-9/11 regulations |
Future Projections (2025–2026)
Anticipated cost trends based on regulatory and market shifts:
| Factor | 2025 Cost | 2026 Forecast | Change | Driver |
|---|---|---|---|---|
| 40ft FCL (Shanghai-LA) | $3,200–$3,750 | $3,400–$4,000 | +6–7% | IMO 2025 sulfur cap compliance |
| Air Freight (>100kg) | $33–$36/kg | $35–$38/kg | +6–8% | Rising jet fuel prices |
| Rail (China-US) | $25–$30/kg | $18–$22/kg | -25–30% | Scale from increased volume (5.1M TEU by 2030) |
| EMS Postal (1kg) | ¥405 | ¥430–¥450 | +6–11% | Labor and logistics inflation |
These tables provide a structured, data-driven overview of China-US shipping costs, enabling businesses to compare modes, anticipate fluctuations, and optimize strategies.